

Technical Support:
158-7527-1139

In order to clarify the chemical components and major source changes of fine particulate matter (PM2.5) in our city and implement more targeted treatments, the Municipal Environmental Protection Bureau has deepened its PM2.5 source apportionment research following the release of results in 2014 and 2015. Currently, the 2016 PM2.5 source apportionment research has been completed and passed expert review.
In 2016, the Municipal Environmental Protection Bureau organized the Municipal Environmental Monitoring Center Station to follow the technical standards of the Ministry of Environmental Protection. Samples were collected between July-August and October-November at three monitoring sites: Guangzhou Environmental Monitoring Center (Gongyuanqian), Huashi Kangda College (Jiulong Town), and Wanqingsha Middle School (Wanqingsha). More than 200 groups of valid samples and over 500 filter membranes were collected. By analyzing mass concentration levels and chemical components and using the receptor model (PMF), the main sources and proportions of PM2.5 in Guangzhou's ambient air for 2016 were obtained.
Research results show that the chemical components and source composition of PM2.5 in Guangzhou in 2016 were generally consistent with 2015, with changes in some indicators. In 2016, coal-fired sources accounted for the largest proportion at 19.9%; followed by motor vehicle exhaust at 16.3%; biomass burning and agricultural area sources each accounted for 10.1%; natural sources, ship emissions, industrial processes, dust, domestic area sources, and other sources accounted for 9.4%, 8.9%, 8.1%, 7.5%, 5.8%, and 3.8% respectively (see Figure 1). Source composition varied slightly by region: urban areas had higher proportions of vehicle exhaust, industrial processes, and domestic sources than suburbs. Biomass burning and dust had a greater impact on northern Guangzhou, while coal-fired and ship emissions had a greater impact on southern Guangzhou (see Figure 2).
The chemical composition of PM2.5 in our city is complex, mainly formed by the secondary transformation of gas precursors such as VOCs, SO2, NOx, and ammonia. Organic matter has the highest mass concentration proportion, accounting for 37.0% of total PM2.5 mass. Organic matter, sulfates, nitrates, and ammonium salts together account for 71.5% of total PM2.5 mass. There is little difference in the main chemical components across different regions.
Results also indicate that the mass concentrations of main chemical components and the contribution of various pollution sources in 2016 generally decreased compared to 2015, showing the effectiveness of comprehensive prevention measures. By the end of 2016, 29 thermal power units with a total capacity of 5.199 million kilowatts completed "ultra-clean emission" transformations, matching gas unit levels. Over 200,000 yellow-label vehicles were eliminated, and long-term mechanisms for industrial coal and vehicle pollution prevention were established. Management of construction sites, road dust, and catering pollution improved, and VOC treatment and non-road mobile source control (like ships) progressed. Analysis shows organic matter, sulfates, ammonium salts, heavy metals, and elemental carbon decreased by 2.15, 0.77, 0.25, 0.20, and 0.18 μg/m³ respectively compared to 2015, while nitrates rose by 0.86 μg/m³. Coal-fired, industrial, domestic, biomass, and dust sources decreased by 1.79, 1.77, 1.36, 1.22, and 1.09 μg/m³ respectively, while mobile and agricultural sources increased by 1.32 and 0.18 μg/m³.
The 2016 source apportionment also analyzed three typical pollution processes with high PM2.5 concentrations. Results show high concentrations are mainly due to unfavorable meteorological conditions or abnormal anthropogenic emissions, such as firework displays from New Year's Eve to New Year's Day (Feb 7-8).
Next, the city will utilize these results to implement control measures in key areas like energy structure, industrial layout optimization, coal pollution treatment, vehicle pollution prevention, dust supervision, and VOC prevention. Key tasks include: 1. Increasing NOx reduction for buses and promoting electric buses; 2. Improving VOC treatment and supervision; 3. Monitoring abnormal anthropogenic emissions, such as straw burning and fireworks; 4. Continuing energy structure upgrades and coal plant monitoring; 5. Studying the relationship between emissions and meteorology for targeted reduction; 6. Continuing research on PM2.5 and ozone causes and improving emission inventories to support refined environmental management.
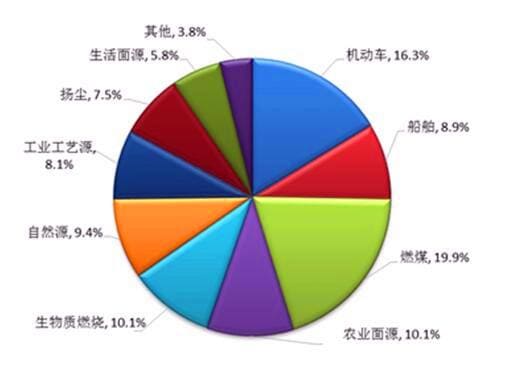
Figure 1: Guangzhou 2016 PM2.5 Source Composition Chart
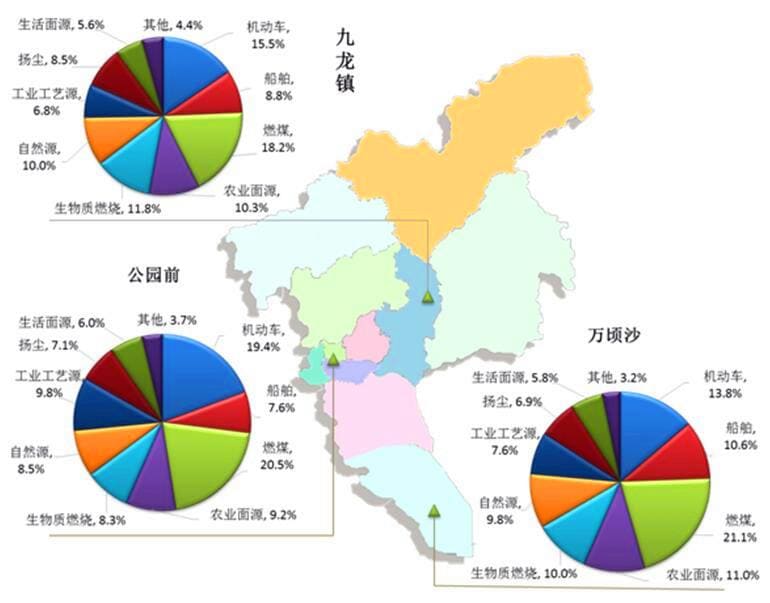
Figure 2: Guangzhou 2016 PM2.5 Source Apportionment Results (Different Sites)
Luftmy PM2.5 sensor application areas: air purifiers, air conditioners with purification, PM2.5 detectors, range hoods, smoke alarms, fresh air systems, dedicated PM2.5 sensors, air detectors, etc.